

Actionable analytics is data analysis that ends in a specific, assigned intervention rather than a chart. It works by converting a finding, say, a drop in close rates for one sales rep, into a prioritized action with an owner and a deadline. The distinction is decisive: a dashboard that gets studied is reporting; a dashboard that triggers a call, a price change, or a reassigned lead is actionable analytics.
TL;DR:
- Only actions, not reports, drive value, so assigning a clear owner and deadline is essential for implementing insights effectively.
- Speed and automation are crucial, with real-time alerts and rule-based triggers surfacing problems promptly to prevent delays.
- Focusing on decision-relevant KPIs, like revenue per lead or churn rate, ensures data influences actual choices rather than producing vanity metrics.
- The six-step cycle, from defining questions to evaluating outcomes, is necessary for successful analytics initiatives, with organizational clarity guiding each stage.
- Ownership and accountability are more important than technology; naming responsible individuals and fostering organizational change are key to making analytics actionable.
Table of Contents
- Actionable Analytics and the Data-Driven Decision Cycle
- How This Differs From Traditional Reporting and BI
- The Business Case: What Actionable Analytics Actually Delivers
- The Six-Step Process for Turning Data Into Action
- Best Practices for Making Actionable Analytics Stick
- How Sales-phoenix Applies This Framework in Practice
- When You're Actually Ready to Invest
- Turn Revenue Leaks Into Assigned Actions, Not Reports
- A Practitioner's Take: Why Most Analytics Initiatives Never Pay Off
- Sources
- FAQ
Actionable Analytics and the Data-Driven Decision Cycle
Actionable analytics only earns the name when it's tied to a decision trigger, not just a report someone glances at during a Monday meeting. That distinction sounds academic until you watch two companies handle the same warning sign. One prints a chart showing churn ticking up. The other builds a workflow that flags the accounts at risk and routes them to a retention specialist within 24 hours. Only the second company is practicing actionable analytics.
The four recognized analytics types each play a distinct role in that process:
- Descriptive analytics answers what happened (revenue dropped 8% in Q3).
- Diagnostic analytics answers why (a top referral partner stopped sending leads).
- Predictive analytics answers what's likely next (accounts with this pattern usually churn within 60 days).
- Prescriptive analytics answers what to do about it (reassign the account, offer a retention incentive, escalate to leadership).
Skipping straight to dashboards without asking which decision the data should inform is the single most common reason companies collect terabytes of information and still fly blind. Global daily data generation now exceeds 402.74 million terabytes, and most of it never touches a decision at all.
How This Differs From Traditional Reporting and BI
Traditional business intelligence answers "what happened." Actionable analytics answers "what happens next, and who's doing it." The practical difference shows up in three places:
- Ownership: reports get viewed; actions get assigned to a named person with a deadline.
- Speed: static reports update weekly or monthly; action pipelines rely on alerts and near real-time feeds that flag anomalies as they happen.
- Automation: instead of a human scanning a dashboard for problems, rule-based triggers and severity scoring surface the issue automatically and route it to whoever owns the fix.
The failure mode is familiar to anyone who has sat through a quarterly business review: a beautifully designed dashboard nobody acts on because no one owns the follow-through. Tableau's research on enterprise adoption found that governance and clear ownership, not the visualization tool itself, determine whether insights get used.
Pro Tip: Before building another dashboard, ask who will act on it and within what timeframe. If you can't name a person and a deadline, you're building a report, not an action system.
The Business Case: What Actionable Analytics Actually Delivers
The payoff shows up in four places executives already track: faster decisions, recovered revenue, better retention, and lower operating costs. Organizations that lean into data-driven decision-making are significantly more likely to report improved decision outcomes, and they move from reactive firefighting to catching problems early.
Highly data-driven organizations report better decision-making and gain a proactive advantage by surfacing threats and opportunities before competitors do.
Picking the right KPIs matters more than picking more of them. A useful filter: does this metric map to a decision someone will make differently based on the number? Revenue per lead, time-to-close, churn rate by segment, and cost per recovered account all pass that test. Vanity metrics like total dashboard views do not.
The Six-Step Process for Turning Data Into Action
Every actionable analytics initiative that works follows some version of the same cycle. Skipping a step is usually why the initiative stalls.
- Define the business question and success metric. Start narrow: "Why are enterprise deals stalling in negotiation?" beats "improve sales performance."
- Collect data and verify quality. Bad instrumentation produces confident, wrong answers faster than no data at all.
- Analyze, moving from descriptive to diagnostic to predictive or prescriptive. Most teams stop at descriptive and wonder why nothing changes.
- Generate prioritized insights and assign an owner. An insight without a name attached to it dies in a shared folder.
- Implement the intervention with a timeline and resources. This is where most "analytics projects" quietly become "analytics reports" again.
- Evaluate outcomes and close the loop. Measure the KPI before and after the intervention to confirm it actually moved.
Each step needs a different kind of attention:
- Steps one and two require patience. Rushing data collection to hit a deadline produces the exact bad data that undermines step three.
- Step three is where the four analytics types get applied in sequence, not all at once.
- Steps four and five live or die on organizational clarity: who decides, who acts, and by when.
- Step six is the step almost everyone skips, and it's the one that proves the whole cycle was worth running.
Streaming architectures now make step two and step six faster than they used to be. AWS documented a near-real-time system using Kinesis, Flink, QuickSight, and SageMaker to detect operational anomalies and trigger interventions inside the same business window, not the next quarterly review.
Best Practices for Making Actionable Analytics Stick
Getting this right has less to do with software and more to do with discipline around ownership and scope. A few practices separate the initiatives that produce results from the ones that quietly die after a promising kickoff meeting.
- Name a decision owner for every recurring metric. If nobody is accountable for acting on a number, it will get watched, not used.
- Pilot before you scale. Tie one business question to one measurable KPI, prove it moves the needle, then expand. Coursera's guidance on data-driven decision-making makes the same case: small, focused tests build the credibility needed for bigger investment.
- Instrument events and build alerts for anomalies, not just retrospective summaries.
- Keep dashboards simple. Every metric on it should map to a decision someone is actually making. If it doesn't, cut it.
- Watch for orphaned dashboards, poor data hygiene, and change management that never happened. These three failures account for most stalled analytics programs.
Pro Tip: Run your pilot on the metric that's already causing arguments in leadership meetings. Political urgency gets budget approved faster than a hypothetical opportunity ever will.
Companies that made this shift, including large financial firms like Charles Schwab and JPMorgan Chase, replaced spreadsheet-based reporting with shared dashboards that became the actual decision artifact teams referenced, not a document that got emailed once and forgotten.
How Sales-phoenix Applies This Framework in Practice
Sales-phoenix built its Phoenix Growth Framework™ around this exact six-step cycle, applied specifically to service businesses and professional firms where revenue leaks hide in plain sight: stalled follow-up, inconsistent pricing, dormant client lists. The framework doesn't stop at identifying the leak.
- It assigns a specific corrective action and an owner inside the client's organization.
- It ties every metric on the executive dashboard to a decision someone is actually making.
- It closes the loop with follow-up measurement, not a one-time report.
Applied across client engagements, this approach has helped recover lost revenue and improve average close rates. The mechanism isn't magic. It's the same insight-to-action discipline outlined above, run with structured intelligence reports instead of static spreadsheets.
When You're Actually Ready to Invest
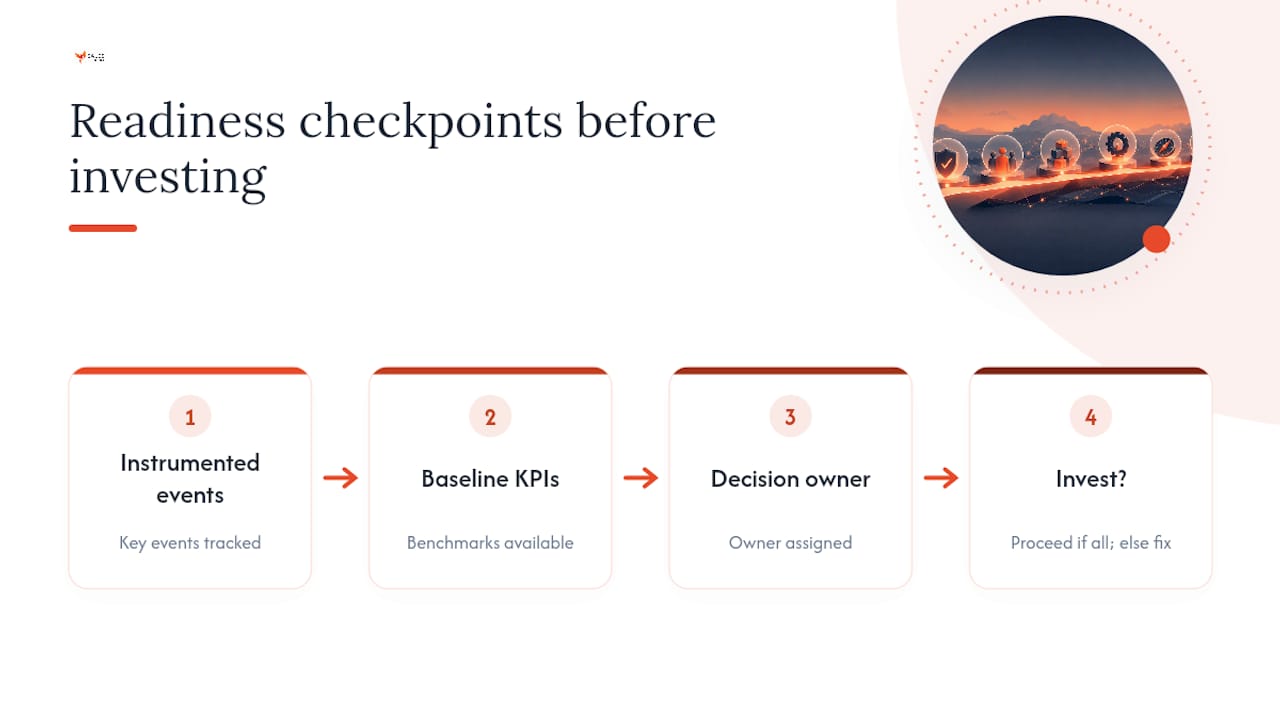
Three signals say go: your key events are instrumented, you have baseline KPIs to compare against, and someone has agreed to own the decisions that come out of the data. Missing any of those, fix data hygiene and ownership first. Chasing a dashboard before that groundwork is done wastes budget on visualization nobody will use.
Turn Revenue Leaks Into Assigned Actions, Not Reports
Sales-phoenix is the practical next step for firms that read this and recognized their own dashboard problem: plenty of reporting, not enough follow-through. Where most consultants hand over a slide deck and disappear, Sales-phoenix builds the ownership structure and follow-up cadence into the engagement itself, so insights turn into assigned interventions instead of another PDF nobody opens.
That starts with pinpointing where revenue is actually leaking. The Phoenix Revenue Intelligence service maps stalled leads, missed follow-ups, and pricing inconsistencies to specific dollar amounts, then hands you a prioritized action list with owners attached. Firms that need broader operational visibility can start with the full services catalog, which covers everything from database reactivation to fractional COO advisory for teams that need ongoing execution leadership, not just a diagnosis.
If your team is buried in dormant client data with no clear read on where the money went, book a growth assessment and get a specific answer instead of another dashboard.
A Practitioner's Take: Why Most Analytics Initiatives Never Pay Off
Most companies don't have an analytics problem. They have an ownership problem dressed up as a data problem. I've seen the pattern often enough to call it: leadership commissions a beautiful dashboard, celebrates the launch, and six months later nobody can say who's supposed to act on the numbers it shows. The tool gets blamed. The tool was never the issue.
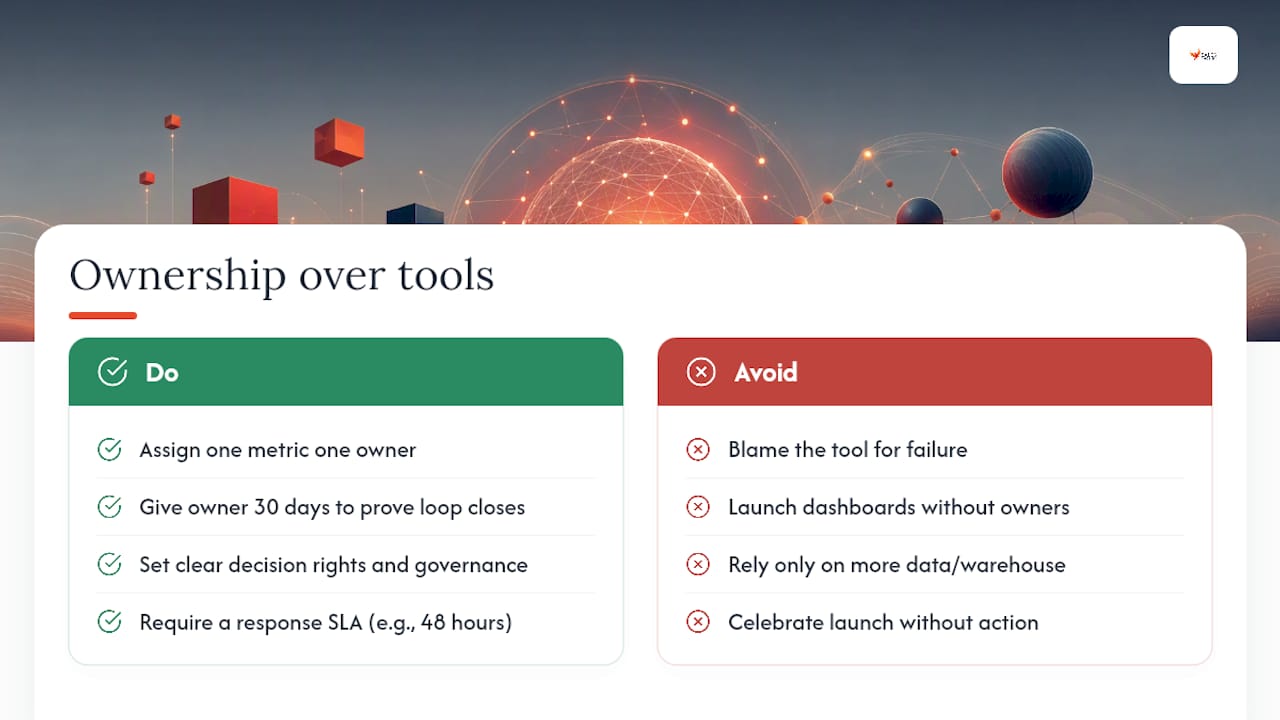
The conventional wisdom says you need better data, more sources, a bigger warehouse. Sometimes that's true. More often, the fix is smaller and less glamorous: pick one metric, name one person who owns the response to it, and give them 30 days to prove the loop closes. Tableau's own research on enterprise adoption backs this up: governance and clear decision rights predict whether insights get used far more reliably than which visualization platform a company bought.
The uncomfortable part is that this requires organizational change, not a software purchase. Somebody has to own the awkward conversation about why a metric that used to get "reviewed" now requires a response within 48 hours. Companies that skip that conversation end up with the same orphaned dashboards, just prettier ones.
— Hunter
Sources
- What Is Data-Driven Decision-Making (DDDM)? And How to Get Started | RMIT Online
- The Advantages of Data-Driven Decision-Making | HBS Online
- What Is Data-Driven Decision-Making? | IBM
- A Guide To Data Driven Decision Making | Tableau
- Near-real-time baggage operational insights for airlines using Amazon Kinesis Data Streams | AWS
FAQ
What Are Actionable Analytics?
Actionable analytics is data analysis structured to produce a specific decision or intervention, not just a report. It combines descriptive, diagnostic, predictive, and prescriptive analytics to identify a problem, recommend a fix, and assign ownership for carrying it out.
What Are the Four Types of Analytics?
The four types are descriptive (what happened), diagnostic (why it happened), predictive (what's likely next), and prescriptive (what to do about it). Actionable analytics typically uses all four in sequence, moving from understanding a problem to recommending a specific fix.
What Is Action Analytics?
"Action analytics" is generally used interchangeably with actionable analytics: analysis paired with an assigned intervention and a measurable follow-up. The key marker is a named owner and deadline, not just a chart or summary.
What Is an Example of an Actionable Insight?
A common example: a firm notices deals stall after a specific pricing objection, then assigns a sales manager to test a revised pricing script on stalled deals. Sales-phoenix applies this same pattern through its Phoenix Revenue Intelligence service, converting stalled-deal patterns into specific, owned corrective actions.
How Much Does Sales-phoenix Charge for Analytics Consulting?
Pricing for Sales-phoenix's services, including Phoenix Revenue Intelligence and Executive Dashboard builds, is available directly on the services page rather than published as a flat rate, since engagements are scoped to each firm's revenue systems.