

ACV is your deal-level sizing metric; ARR is your company-level run-rate metric. Sales and RevOps teams lean on ACV to size quotas and price deals, while leadership and investors read ARR to gauge overall momentum and valuation. Neither replaces the other, but both are only useful if everyone in the building agrees on what counts as recurring revenue in the first place.
TL;DR:
- ACV reflects deal size at the contract level and can include or exclude one-time fees depending on the chosen method, affecting overall analysis.
- ARR provides a company-level, year-over-year recurring revenue snapshot, calculated through methods like Monthly Recurring Revenue times 12 or roll-forward calculations incorporating churn and upsells.
- Comparing ACV and ARR requires consistent definitions and clear segmentation, as blending different fee types or deal sizes can distort trend analysis and forecasting accuracy.
- Tracking ACV by cohort reveals shifts in deal composition, which can signal potential future risks or opportunities hidden within aggregate ARR growth.
- Financial due diligence and revenue forecasting depend heavily on maintaining an accurate, standardized measurement system, with dashboards that flag data drift before it impacts decision-making.
Table of Contents
- What Is ACV (Annual Contract Value) and How Do You Calculate It?
- What Is ARR (Annual Recurring Revenue) and How Do You Calculate It?
- ACV vs. ARR: Side-by-Side Comparison
- When to Use ACV vs. When to Use ARR
- Formulas and Worked Examples for Your Spreadsheet
- Common Pitfalls and a Governance Checklist
- How Revenue Intelligence Turns These Metrics Into Action
- What ACV and ARR Mean for Revenue Forecasting
- How Upgrades, Downgrades, and Churn Move ACV and ARR
- ACV and ARR in Fundraising and M&A
- A Practitioner's View on Getting This Right
- Where Sales Phoenix Fits Once Your Metrics Are Defined
- Sources
- FAQ
What Is ACV (Annual Contract Value) and How Do You Calculate It?
Annual contract value, or ACV, measures the yearly worth of a single customer contract. Sales teams use it to size quotas, RevOps uses it to segment pipeline, and finance uses it to sanity check CAC payback math from US Market Intelligence. The catch is that "ACV" means different things depending on whether one-time fees get folded in.
There are two common versions worth distinguishing:
- Strict recurring ACV: only the subscription or recurring-fee portion of a contract, excluding onboarding, implementation, or other one-time charges.
- Amortized ACV: spreads one-time fees across the contract's first year (or its full term), giving a fuller picture of what a deal is actually worth to the business.
For a single contract, the formula is simple: total contract value divided by contract length in years. A multi-year deal's ACV is calculated by dividing the total contract value by the number of years in the contract. Average ACV across a book of business is just the sum of individual contract ACVs divided by the number of contracts. Monthly billing gets converted by multiplying the monthly recurring fee by 12. Stripe's breakdown of ACV and ARR notes that companies often customize whether setup fees get amortized into ACV or excluded entirely. Whichever you choose, apply it consistently across every contract.
What Is ARR (Annual Recurring Revenue) and How Do You Calculate It?
ARR is a snapshot of your recurring revenue run rate at a given moment. It's not a forecast and it's not cash collected. It's what your current subscription base would generate over the next 12 months if nothing changed.
The most common calculation methods:
- MRR × 12: take monthly recurring revenue and multiply by 12, the fastest way to get a directional number.
- Roll-forward method: beginning ARR, plus new ARR from new logos, plus expansion ARR from upsells, minus churned ARR, minus downgrade ARR.
- Contract aggregation: sum the recurring (non one-time) portion of every active contract's annualized value.
The roll-forward method matters more than most teams realize because it shows why ARR moved, not just that it moved. Klipfolio's guide to ACV and ARR calculations frames ARR as the total annualized recurring revenue across all active contracts, which is why finance teams treat it as the cleanest momentum metric available. One-time professional services should stay out of ARR entirely unless a service is genuinely repeating every billing cycle. Mixing them in, even occasionally, distorts trend lines and makes quarter-over-quarter comparisons meaningless.
ACV vs. ARR: Side-by-Side Comparison
The two metrics answer different questions, which is exactly why comparing them side by side clears up most of the confusion.
| Dimension | ACV | ARR |
|---|---|---|
| Scope | Deal-level (per contract) | Company-level (aggregate) |
| Formula | Total contract value ÷ contract years | MRR × 12, or roll-forward of active contracts |
| Includes one-time fees? | Sometimes, if amortized deliberately | No, excluded by default |
| Primary audience | Sales, RevOps, deal desk | Executives, investors, finance |
| Typical use | Quota sizing, deal sizing, CAC comparisons | Forecasting, valuation, board reporting |
The two metrics connect through simple math: sum every active contract's recurring ACV, and you get ARR. That's also the fastest way to catch a reporting error. If your finance dashboard shows an ARR number that doesn't match the sum of recurring ACV across your CRM, one of the two systems is applying a different rule for one-time fees, and someone needs to find out which one before the board deck goes out.
When to Use ACV vs. When to Use ARR
The decision usually comes down to who's asking and what they're deciding.
- Sales leaders and RevOps reach for ACV when setting quotas, benchmarking rep performance, or deciding whether a deal is worth the sales cycle it will consume.
- CFOs and finance teams use ARR to build revenue forecasts, calculate net revenue retention, and prep valuation conversations.
- Founders and boards want ARR in the deck, but they should ask for ACV trends underneath it, since a shrinking average deal size can hide inside flat or growing ARR.
- Deal desks use ACV bands to route opportunities to the right sales motion.
Those bands matter more than most teams give them credit for. VCBeast's comparison of ACV and ARR lays out a rough map: Deals can be categorized into bands that roughly map to go-to-market approaches: lower-value deals tend to require high-volume, low-touch motions; mid-range deals typically fit inside sales models; higher-value deals usually need enterprise-level, high-touch sales with longer cycles. Get the band wrong and you'll either overstaff a low-ACV segment or under-resource a deal that needed a real sales conversation.
A board deck typically cites ARR and its growth rate, while a weekly sales ops report may cite ACV by segment to reflect pipeline mix changes.
Pro Tip: Track ACV by cohort, whether that's by acquisition channel, region, or industry vertical, not just as one blended number. A blended ACV can look stable while masking a real shift underneath: enterprise deals shrinking while SMB deals grow, or vice versa.
Formulas and Worked Examples for Your Spreadsheet
Numbers make this concrete. Three quick examples, ready to drop into a spreadsheet.
- Multi-year contract: a $90,000 contract signed for three years produces an ACV of $30,000 per year. VCBeast's worked example uses this exact calculation to show why total contract value and ACV are not the same number.
- Monthly subscription to ARR: a customer paying $2,500 per month has an ACV of $30,000 annually. Multiply that customer's monthly fee by 12, then repeat across your customer base and sum the results to get total ARR.
- Segmented aggregation: If your SMB segment has many customers with a certain average ACV and your enterprise segment has fewer customers with a higher average ACV, the blended ARR sums the recurring revenue contributions from both segments.
| Input needed | Why it matters |
|---|---|
| Contract length | Converts total value into an annualized figure |
| One-time fee treatment | Determines whether setup costs inflate first-year ACV |
| Billing frequency | Needed to convert monthly or quarterly fees to annual |
| Active contract count | Required to aggregate ACV into total ARR |
Get those four inputs standardized across your CRM and billing system, and the ACV-to-ARR math stops being a monthly argument.
Common Pitfalls and a Governance Checklist
Most ACV/ARR confusion doesn't come from bad math. It comes from two teams applying different rules to the same word.
- Treating one-time implementation fees inconsistently, amortized in one dashboard, excluded in another.
- Letting bookings or total contract value slip into an ARR chart, inflating a metric that's supposed to represent recurring revenue only.
- Reporting a single blended ACV number without segmenting by cohort, which hides shifts in deal size and sales motion.
- Updating the CRM's ACV field manually instead of pulling it from billing data, which drifts out of sync within a quarter or two.
Mercury's overview of revenue metrics points to inconsistent internal definitions as one of the biggest risks in revenue reporting, and the fix is almost always the same: pick one documented formula, apply it at the source system (billing or CRM), and note explicitly which fees are recurring versus one-time. When dashboards stop matching, reconcile monthly by summing recurring ACV across active contracts and checking it against reported ARR. If the numbers diverge, the definition drifted somewhere, not the business.
How Revenue Intelligence Turns These Metrics Into Action
Metric definitions only matter if someone builds a dashboard that enforces them. That's the practical work behind revenue intelligence: translating agreed formulas into a system that flags drift before it reaches a board deck.
A useful build order looks like this:
- Segmented ACV dashboard first, broken out by cohort and GTM motion.
- ARR roll-forward next, showing new, expansion, churn, and downgrade separately rather than one net number.
- CAC payback view last, layered on top once ACV and ARR are both trustworthy.
A growth framework was built around this exact sequencing: fix the measurement layer before touching the sales process.
What ACV and ARR Mean for Revenue Forecasting
Forecasting off ARR alone works until deal mix shifts underneath it. A company projecting next year's revenue purely from a top-line ARR growth rate assumes the composition of that revenue stays constant, same average deal size, same churn pattern, same expansion rate. That assumption breaks more often than forecasters expect.
ACV trends feed the forecast in a way ARR alone can't. If blended ACV is falling while customer count is rising fast enough to keep ARR growing, the forecast needs a different CAC assumption than a forecast built on stable or rising ACV. Sales cycles, onboarding load, and support costs all scale differently depending on whether growth is coming from many small deals or fewer large ones.
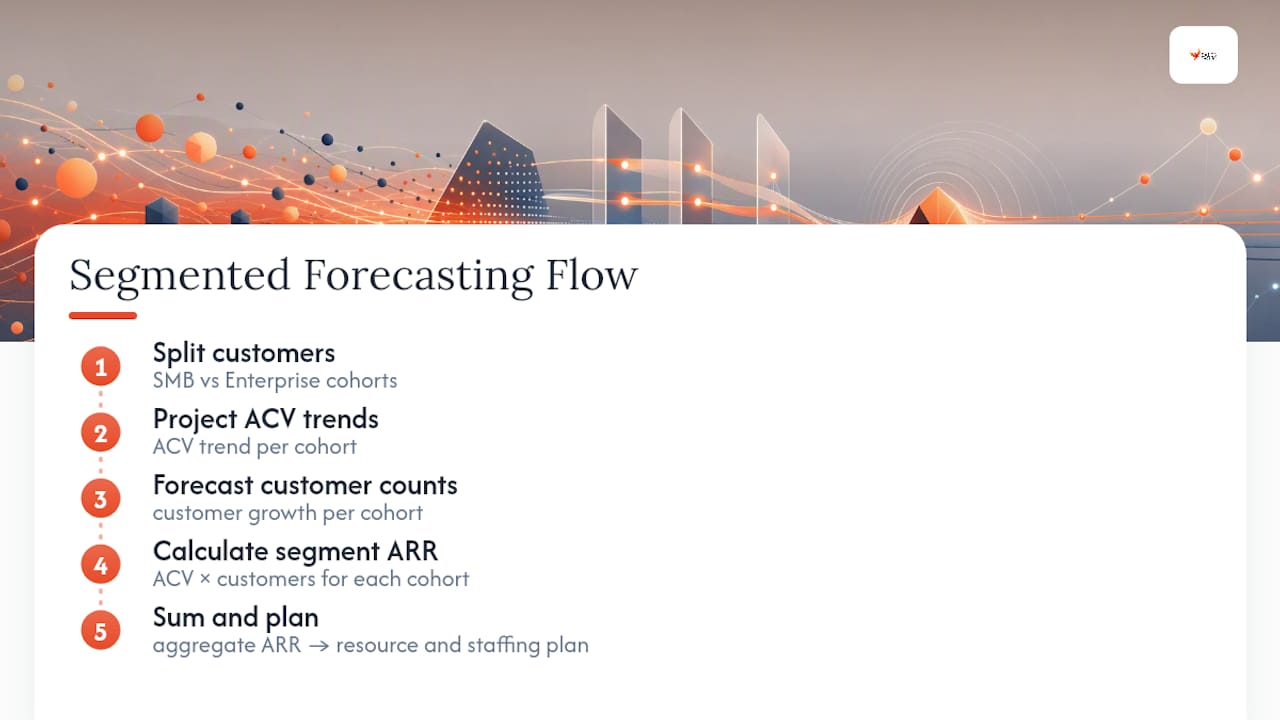
The most reliable forecasting models split by segment: project ACV trends and customer counts separately for each cohort, then sum the segment-level ARR projections rather than applying one blended growth rate to the whole business. This catches a scenario blended forecasting misses entirely, like an SMB segment saturating while enterprise is just accelerating, which produces a very different resource plan than a single smooth growth curve suggests. A forecast built on segmented ACV and ARR also gives finance a defensible answer when a board member asks why the growth rate changed quarter over quarter. "Our enterprise ACV dropped because we closed more mid-market deals" is a specific, checkable answer. "Growth slowed" is not.
How Upgrades, Downgrades, and Churn Move ACV and ARR
Expansion revenue, contraction, and churn hit ACV and ARR differently, and mixing them up in a report causes real confusion.
An existing customer upgrading to a higher tier increases that customer's individual ACV and adds expansion ARR to the company total, without adding a new logo or new customer count. A downgrade does the reverse: that customer's ACV falls, and the difference shows up as contraction ARR, a drag on the roll-forward calculation even though the customer hasn't churned. Full churn removes both the customer and their ACV contribution from the count, and the entire recurring value drops out of ARR.
This is why net revenue retention exists as a separate metric from gross ARR growth. A business can add enough new-logo ARR to mask serious contraction happening inside its existing base. Tracking ACV movement at the individual customer level, not just aggregate ARR, is often the earliest warning sign of a retention problem. If average ACV among renewing customers is trending down even as total ARR grows from new sales, the existing customer base is quietly eroding, and no amount of new bookings fixes that trend on its own.
ACV and ARR in Fundraising and M&A
Investors and acquirers price SaaS companies primarily off ARR, usually through an EV/ARR multiple, which is why Stripe's guidance on ACV and ARR frames ARR as the metric leadership and investors actually rely on for valuation conversations. But diligence rarely stops at the headline ARR number. Buyers and investors dig into ACV composition almost immediately, because two companies with identical ARR can carry very different risk profiles depending on deal concentration and average contract size.
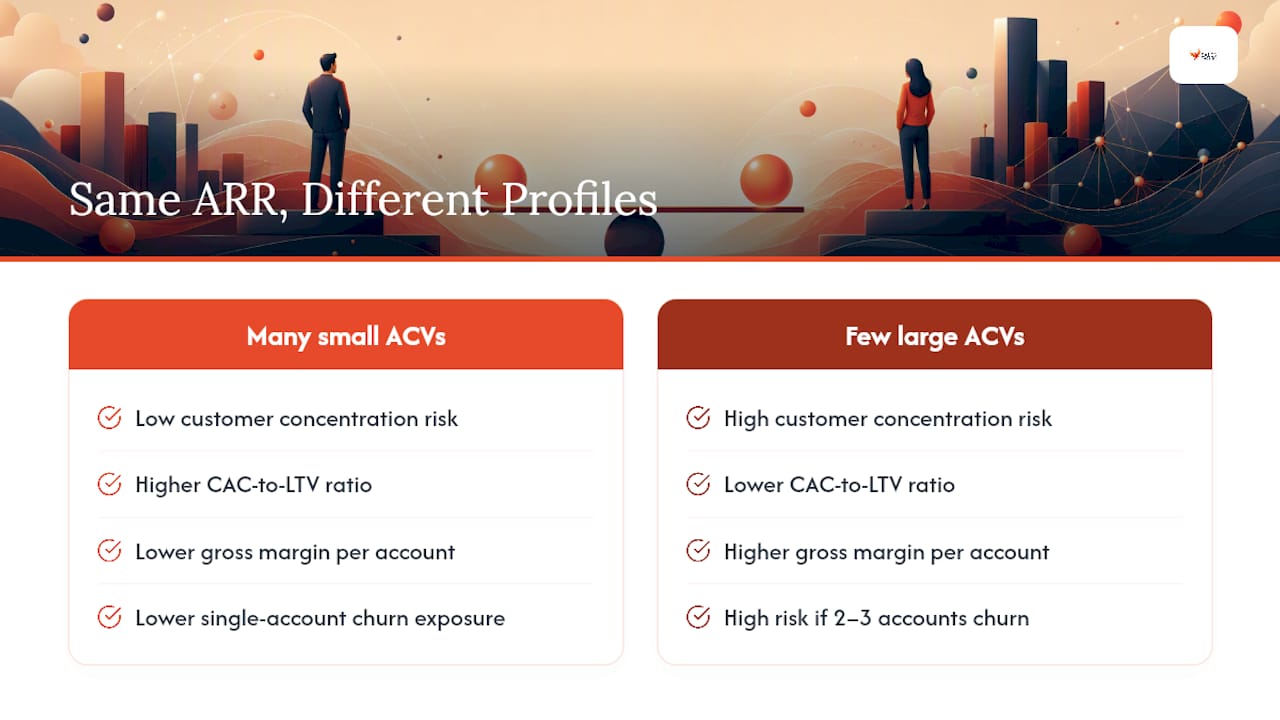
Companies with the same ARR but different customer and ACV compositions have structurally different profiles, customer concentration risks, and sales cost dynamics. The first carries less customer concentration risk but likely a higher CAC-to-LTV ratio. The second is more exposed if two or three large accounts churn, but usually carries better gross margins per account. Diligence teams model both scenarios, and a founder who can produce clean, segmented ACV data alongside a properly reconciled ARR roll-forward moves through that process faster than one who can only offer a blended top-line number.
This is also where inconsistent ACV/ARR definitions get expensive. A revenue quality review during diligence that finds one-time fees baked into what a company called "ARR" doesn't just correct a number, it undermines trust in every other figure in the data room.
A Practitioner's View on Getting This Right
A recurring theme in client engagements isn't that teams don't understand ACV and ARR. It's that two departments define them differently and nobody notices until a board number doesn't reconcile. The fix is rarely more sophisticated math. It's picking one formula, writing it down, and applying it everywhere. Teams that do this early spend less time defending their numbers and more time acting on them.
— Hunter
Where Sales Phoenix Fits Once Your Metrics Are Defined
Getting the formulas right is only half the job. The harder part is building a system that catches drift the moment ACV and ARR stop reconciling, before it reaches a board deck or a diligence request. That's the gap a Revenue Leak Assessment is built to close: a diagnostic pass through your current dashboards, CRM fields, and billing exports to find exactly where recurring and one-time revenue are getting blended, and where segmented ACV data is missing entirely.

Teams that go through this process typically gain a documented formula set, a segmented ACV view by cohort, and an ARR roll-forward that is trusted across departments. If your dashboards have ever disagreed about your own ARR number, or if a board question about ACV trends has ever produced three different answers from three different systems, book a Revenue Leak Assessment and get the measurement layer fixed before it costs you a forecast or a fundraise.
Sources
- ACV, ARR, CARR, or MRR? An overview of the most common revenue metrics | Mercury
- ACV vs ARR: Key differences and how to calculate them | VCBeast
- ACV vs ARR: key differences and how to calculate them | Klipfolio
FAQ
What does ACV mean in SaaS?
ACV stands for annual contract value, the yearly worth of a single customer contract, used mainly by sales and RevOps teams for quota sizing and deal comparisons.
Is ACV the same as revenue?
No. ACV is an annualized contract metric, not recognized revenue; a company can have high ACV contracts but recognize that revenue over months or years depending on accounting treatment.
Why use ARR instead of total revenue?
ARR isolates the recurring subscription portion of a business and strips out one-time fees, giving investors and executives a cleaner momentum metric than total revenue, which can include services, hardware, or non-recurring charges.
Is ARR or net revenue retention more important?
They answer different questions. ARR shows the size of your recurring revenue base, while net revenue retention shows whether existing customers are expanding or shrinking within that base, and tracking both together catches problems that either metric alone would miss.
How does ACV relate to the number of customers and ARR?
ARR is roughly equal to average ACV multiplied by the number of active customers, which is why a rising customer count can mask a falling average deal size unless you track both figures separately.