

Tie your revenue forecast to actual delivery capacity, weight your pipeline by historical win rates, and run a weekly forecast-versus-actual review. Do those three things and most service businesses cut forecast variance sharply within 90 days. The fix isn't a better spreadsheet formula. It's treating billable hours as inventory, treating open deals as probabilities instead of hopes, and treating Monday-morning review as a non-negotiable ritual rather than a task that slides.
TL;DR:
- Ensuring timesheet and CRM data hygiene, updating rolling forecasts monthly, and accurately modeling available hours are essential for quick forecast improvements.
- Calculating capacity-constrained revenue based on realistic utilization prevents overly optimistic pipeline assumptions from skewing forecasts.
- Weighting pipeline deals by historical win rates and creating multiple scenario forecasts improve accuracy and early warning capabilities.
- Reliable CRM data and disciplined governance, with clear ownership, are crucial to maintaining forecast accuracy over time.
- Regularly measuring forecast variance and bias, and addressing data leaks between sales, delivery, and finance, are vital for sustained forecast reliability.
Table of Contents
- What Actually Moves the Needle on Forecast Accuracy Improvement
- Operational Data and Capacity Alignment: The Ground Truth for Service Forecasts
- Pipeline Probability Scoring and Scenario Modeling
- Tools and AI: When to Invest and What Data They Actually Need
- Process, Ownership, and Governance to Keep Forecasts Honest
- How Do You Measure and Verify Forecast Improvement?
- A Practitioner's View: What We Fix First and Why It Works
- Get a Revenue Leak Assessment Before Your Next Forecast Cycle
- Sources
What Actually Moves the Needle on Forecast Accuracy Improvement
Before touching a model or buying software, fix the five things that quietly wreck most service-firm forecasts. This is the order that produces results fastest, based on what breaks first in professional services.
- Mandate timesheet and CRM hygiene this week. Require entries within 24 hours and lock required fields (lead source, expected start date, job type) so nothing closes without them.
- Switch from a static annual forecast to a rolling one. Update it monthly, with operational inputs like hours and pipeline refreshed weekly, since rolling forecasts prevent stale assumptions from compounding.
- Calculate real available billable hours for the next quarter and check whether your utilization assumption is actually 70 to 80%, not the 90% wishful number sitting in last year's model.
- Weight every open pipeline deal by its historical win rate for that stage and source, not by the rep's gut feeling.
- Split contracted, recognized, and collected revenue into three separate lines, and map how many days typically pass between invoicing and cash landing.
None of these require new software. They require discipline enforced starting Monday.
Operational Data and Capacity Alignment: The Ground Truth for Service Forecasts
Hours are your inventory. A product company runs out of stock; a service firm runs out of billable capacity, and most owners never model that limit into their revenue forecast. They forecast off the pipeline alone, ignore whether the team can actually deliver the work, and then wonder why signed contracts sit unstarted for six weeks.
The fix starts with a hard-cap calculation: available billable hours × realistic utilization × blended rate, which equals capacity-constrained revenue. If your team has 2,000 available hours next quarter and you're realistically running 75% utilization, not the 90% someone put in a slide deck two years ago, your true revenue ceiling is very different from what your pipeline suggests. This capacity-to-revenue conversion gives you a guardrail against overly optimistic sales assumptions.
Practical steps that make this stick:
- Build one unified data layer, a PSA tool or a well-configured CRM, so sales and delivery see the same numbers.
- Set a hard weekly deadline for timesheet submission, no exceptions for partners or senior staff.
- Reconcile work-in-progress against actual burn every week, not at month-end when it's too late to adjust.
- Model start-lag explicitly. New signed clients rarely start the Monday after signature; build in the real onboarding delay.
Pro Tip: Run last quarter's actual utilization against your forecasted assumption. If the gap exceeds five points, your capacity model is broken before you even look at the pipeline.
Pipeline Probability Scoring and Scenario Modeling
Most service firms forecast pipeline at face value, adding up every open deal's full contract value as if every deal closes. It doesn't. The better method assigns each stage a real win rate based on your own closed-deal history, then applies that percentage to the deal's value.
- Calculate win rates by stage, source, and job type using at least the last 12 months of closed opportunities.
- Cap your pipeline stages at five. More stages than that and reps start gaming which bucket a deal sits in.
- Require lead source and expected start date as mandatory CRM fields before a deal can advance stages.
- Build three scenarios, baseline, best case, and worst case, and present all three to leadership instead of one point estimate.
- Run a weekly forecast-versus-actual review and adjust stage probabilities when the variance tells you they're wrong.
Rolling in leading indicators, like proposal activity, client meeting frequency, and pipeline velocity, gives you an early warning system rather than a lagging report card. Firms that track those signals alongside the point forecast catch revenue shifts earlier than firms relying on the pipeline total alone. That's not a tooling problem. That's a pipeline that never got weighted against reality.
Tools and AI: When to Invest and What Data They Actually Need
Software doesn't fix a forecast built on bad data. It amplifies whatever you feed it, good or bad. Before spending on a platform, check whether you even have the minimum dataset: 6 to 12 months of closed deals with full stage history, lead source, job type, and close date attached to each. Without that, an AI-driven forecasting tool has nothing to learn from.
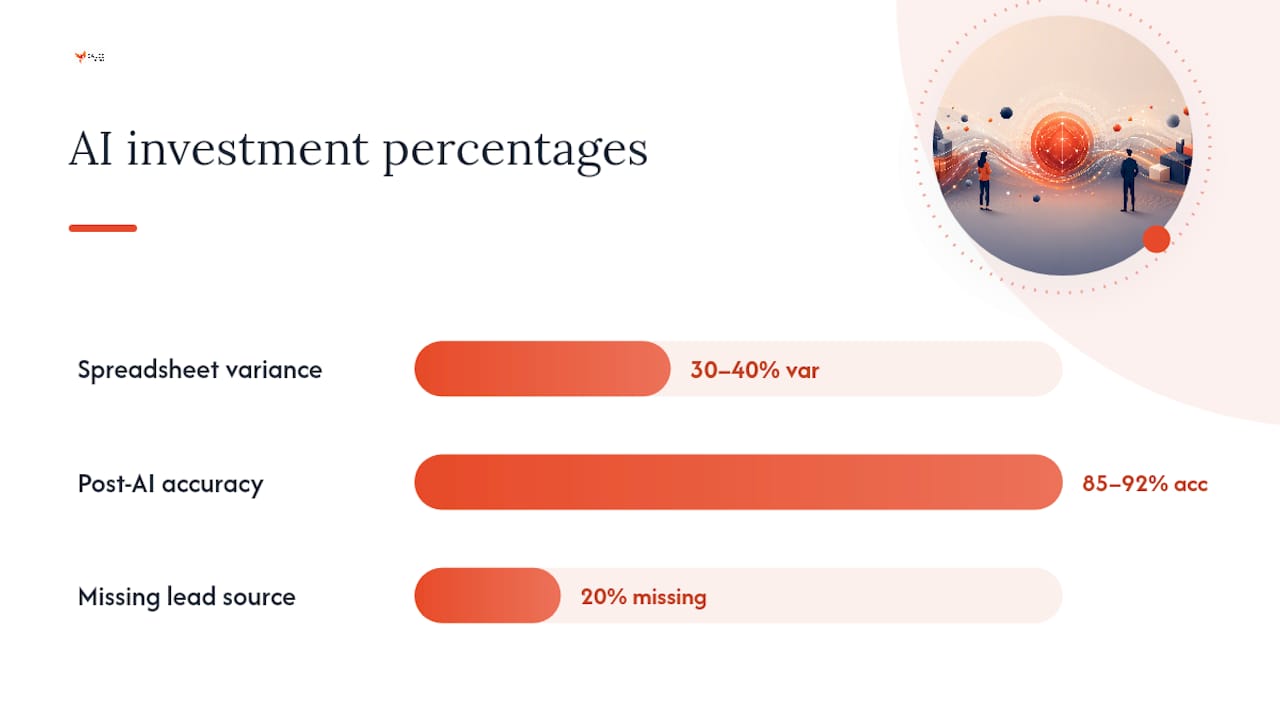
Once that data exists, the upside is real. Service businesses combining AI-assisted scoring with clean CRM inputs have moved forecast accuracy from the 30 to 40% variance typical of spreadsheet guesswork into an 85 to 92% accuracy range within a single quarter. That jump only happens with consistent input discipline behind it.
A PSA platform or an integrated executive dashboard earns its cost when it connects delivery hours, pipeline, and cash in one place instead of three disconnected spreadsheets that disagree with each other by Friday.
- Confirm your CRM already enforces required fields before shopping for AI add-ons.
- Prioritize integrations between your CRM and time-tracking system over standalone forecasting dashboards.
- Expect the model to improve every quarter as more clean data accumulates, not on day one.
Pro Tip: If your CRM has more than 20% of deals missing a lead source, fix that field before you evaluate a single forecasting tool. Automation on dirty data just produces confident wrong answers faster.
Process, Ownership, and Governance to Keep Forecasts Honest
A forecast without an owner drifts. Assign one person accountable for pipeline inputs, one for capacity data, and one who runs the weekly forecast call, and make that someone senior enough to enforce deadlines.
- Time-box the weekly forecast meeting to 20 or 30 minutes. Longer meetings signal the data wasn't ready walking in.
- Make specific inputs mandatory before the meeting starts, updated timesheets, updated stage probabilities, no exceptions.
- Tie forecast outcomes directly to hiring and budget decisions, so missing the forecast has a visible consequence beyond an awkward meeting.
- Build one dashboard combining backlog, capacity, and cash so leadership stops reconciling three separate reports before a decision gets made.
A fractional operational leader can own this cadence when no one internally has the bandwidth or authority to enforce it. Governance, not a fancier model, is usually what separates firms that hit 90% accuracy from ones stuck guessing every quarter.
How Do You Measure and Verify Forecast Improvement?
Forecast accuracy has a simple formula: 100% minus the absolute value of actual minus forecast, divided by actual, times 100. Run that calculation every month, and treat anything consistently below 90% as a signal to dig into your data and process, not a reason to pad next quarter's number.
Track rolling variance and bias separately. Variance tells you how far off you were; bias tells you whether you consistently skew optimistic or pessimistic, which is often the easier fix. Set a 90-day improvement goal, tighten the input discipline covered earlier, and rerun the formula monthly to confirm the gap is closing.
Weekly rollups catch problems early. Monthly rollups tell you whether governance changes or tooling changes actually moved the number, which matters when you're deciding where to spend the next dollar of effort.
A Practitioner's View: What We Fix First and Why It Works
Nearly every service firm has the same invisible leak: sales data in one system, delivery data in another, and finance reconciling both by hand at month-end. Nobody owns the gap between them, so the forecast becomes whichever number sounded reasonable in the last leadership meeting.
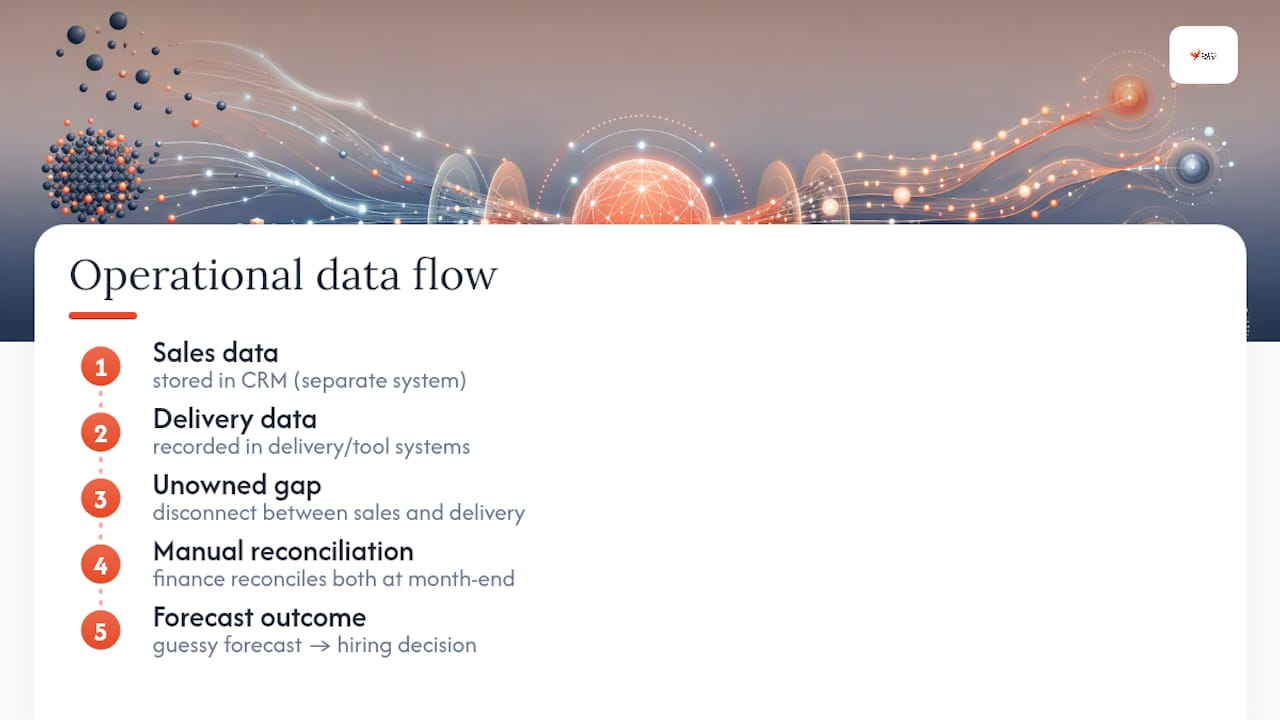
The Phoenix Growth Framework™ starts with assessment, not tooling. We map where revenue actually leaks, unweighted pipeline, unmodeled capacity, invoicing lag, before recommending a single system change. Fix the sequence, and the fix sticks; skip straight to software, and you've automated the same bad habits.
The number that matters most to owners isn't the accuracy percentage. It's the hiring decision they can now make with confidence instead of a guess.
— Hunter
Get a Revenue Leak Assessment Before Your Next Forecast Cycle
The Revenue Leak Assessment targets the gap between what your pipeline says and what your delivery team can actually produce. Instead of guessing which fix matters most, an assessment maps your capacity, pipeline weighting, and cash timing against real data, then hands you a prioritized list, not a generic audit.
The engagement maps directly onto the checklist above: CRM hygiene, capacity modeling, weighted pipeline scoring, and a single executive dashboard that finally puts backlog, capacity, and cash on one screen. If your firm missed its utilization target last year and isn't sure why, that's the exact problem this diagnoses. Start with a Revenue Leak Assessment and find out which of these five fixes will recover the most revenue for your business first.
Sources
- RMI Dayshape Research Report (Q3 2025)
- How to improve revenue forecast accuracy for consulting firms (BigTime)
- AI sales forecasting for service businesses (AnovaGrowth)