

Pipeline coverage ratio is your total qualified pipeline value divided by your revenue target for a period. The quick way to set a target isn't a fixed multiple. It's your own math: required coverage equals 1 divided by your historical win rate. Most teams generally require a coverage ratio within a range influenced by their segment, but the number only means something once you've stripped out stale deals and weighted the rest by probability.
TL;DR:
- Teams should regularly compare weighted pipeline coverage to their derived targets based on win rate to accurately identify true shortfalls.
- Counting stale deals or those in early stages inflates raw coverage and can mask underlying pipeline weaknesses.
- Segmenting coverage by product, region, or rep, and applying recency discounts, provides a clearer picture of actual pipeline risk.
- Persistent coverage ratios below target over multiple quarters indicate structural issues requiring strategic adjustments beyond just increasing activity.
- Using sales analytics tools to validate the quality and recency of pipeline data is crucial for making informed, actionable decisions.
Table of Contents
- What Pipeline Coverage Ratio Actually Measures
- How to Calculate Pipeline Coverage: Raw and Weighted Formulas
- Segment Benchmarks and Deriving Your Own Target
- Cleaning Your Pipeline Data Before You Trust the Number
- Turning a Coverage Gap Into an Action Plan
- Common Pipeline Coverage Mistakes to Avoid
- How Sales Phoenix Fixes Coverage Problems
- When Coverage Numbers Should Trigger a Bigger Strategic Move
- Fixing Coverage Gaps With Sales Phoenix
- Sources
What Pipeline Coverage Ratio Actually Measures
Pipeline coverage tells you whether you have enough open opportunity in the funnel to plausibly hit a revenue number. It's not the forecast itself. The formula is total qualified pipeline value divided by revenue target, and it functions as an early warning system rather than a prediction.
A forecast tells you what you expect to close. Coverage tells you whether you've even given yourself a fighting chance. If a rep's forecast looks fine today but coverage has been thin for three weeks, that forecast is about to get revised downward, because there's no fresh opportunity behind it to replace deals that slip or die.
Raw coverage has a real weakness: it treats a deal that just entered discovery the same as one with a signed proposal sitting in legal review. That's why smart teams lean on a weighted view for anything beyond a rough gut check.
- Coverage answers "do we have enough pipeline," not "will we hit the number."
- Raw coverage is fast to calculate but blind to deal quality.
- Weighted coverage corrects for that blindness by factoring in stage probability.
- A single coverage snapshot means less than the trend over several weeks.
How to Calculate Pipeline Coverage: Raw and Weighted Formulas
The raw version takes thirty seconds. Add up every qualified open deal in the period, divide by the revenue target, and you have your ratio.
- Raw coverage. Say your team's quarterly target is $500,000 and you're carrying $2,000,000 in qualified open pipeline. That's a 4x raw coverage ratio.
- Weighted coverage. Multiply each deal's value by its stage probability, then sum the results. A $2,000,000 pipeline split across early stage (30% at 20% probability), mid stage (40% at 50%), and late stage (30% at 80%) weights out to roughly $890,000, or a 1.78x weighted ratio against that same $500,000 target.
- Expected attainment. Multiply raw coverage by your historical win rate to estimate likely closed revenue. A 4x raw coverage at a 25% win rate implies roughly $500,000 in expected closed business, which happens to land right at target.
Pro Tip: Run both numbers side by side every week. A wide gap between raw and weighted coverage usually means your pipeline is front-loaded with early-stage deals that feel reassuring but won't close on time.
Qualified pipeline should exclude anything without a confirmed next step, a real budget conversation, or an economic buyer identified. Deals sitting untouched for 30+ days with no logged activity don't belong in the count, no matter how big the number looks on a dashboard.
Segment Benchmarks and Deriving Your Own Target
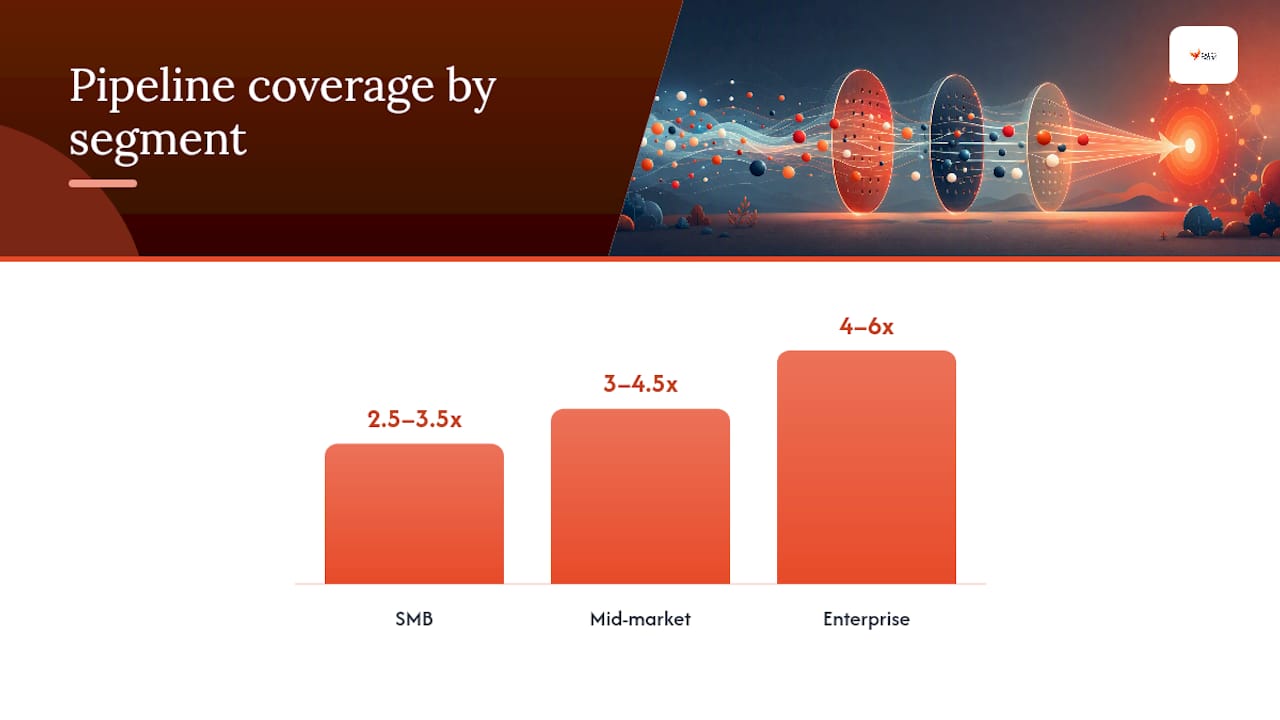
The old 3x rule gets repeated so often that people forget it's a guess, not a law. The right target is derived from your own win rate: required coverage equals 1 divided by win rate. A team with a 25% win rate typically needs coverage around four times their quota, while one with a 40% win rate requires less coverage, closer to two and a half times their quota. Apply a blanket 3x to either one and you're either under-resourced or sitting on pipeline you don't need to chase as hard.
Segment benchmarks reflect this math in practice, with ranges tied to deal cycle and win rate:
- SMB motion: roughly 2.5x to 3.5x, since shorter cycles and higher win rates mean less buffer is needed.
- Mid-market: roughly 3x to 4.5x, balancing longer cycles against moderate win rates.
- Enterprise: roughly 4x to 6x, driven by multi-stakeholder deals and lower, slower-moving win rates.
- Strategic or mega-deals: often higher still, because a single lost deal represents a large share of quota.
Deal cycle length changes how much buffer you need beyond the raw win-rate math. A 90-day enterprise cycle gives deals more time to stall, get re-scoped, or lose their champion, so those pipelines typically carry extra coverage even after adjusting for win rate. Shorter, transactional cycles can run leaner because a slipped deal this week gets replaced by a new one before it damages the quarter.
Cleaning Your Pipeline Data Before You Trust the Number
Coverage math is only as good as what's feeding it. A CRM full of duplicate records, phantom deals, and close dates nobody ever updates will hand you a ratio that looks healthy and means nothing.
Start with deduplication. Merged accounts, re-created opportunities, and deals logged twice after a rep change all inflate the pipeline value without adding real revenue potential. Next, exclude anything past its close date with no recent activity; a deal that was supposed to close last month and hasn't moved isn't pipeline, it's clutter.
Close-date alignment matters more than most teams realize. If you're measuring Q1 coverage but half your "qualified" deals have close dates in Q3, you're comparing pipeline that was never meant to fund this quarter's number.
- Deduplicate accounts and opportunities before every coverage snapshot.
- Drop deals past close date with no logged activity in the last two weeks.
- Align every counted deal's close date to the period you're actually measuring.
- Segment by product line, rep, and motion instead of relying on one company-wide number.
- Apply a recency multiplier that discounts deals with no touch in 14 days or more.
Pro Tip: Build the recency discount directly into your CRM report instead of doing it manually. A deal untouched for three weeks should show up smaller in your coverage math automatically, not just in your gut feeling about it.
Aggregate coverage can look fine while one segment is quietly on fire. A company sitting at healthy overall coverage might have an enterprise team at 1.5x while SMB carries the average up past 5x. Segmenting the number is what turns it into something you can act on.
Turning a Coverage Gap Into an Action Plan
Once you know your required coverage and your actual weighted coverage, the shortfall is just subtraction. If your target is $500,000 and weighted coverage sits at $890,000 against a required 4x ($2,000,000 raw equivalent), you're short. Convert that dollar gap into the number of new opportunities needed at your average deal size and current win rate, then split the work by owner.
- Calculate the gap. Required pipeline value minus current weighted pipeline value gives you the dollar shortfall to close.
- Convert to activity. Divide the gap by average deal size, then by your lead-to-opportunity conversion rate, to get a target number of new leads, demos, or proposals needed.
- Assign owners. Split the activity target across SDRs, AEs, and marketing based on who controls that stage of the funnel.
- Pull short-term levers. Accelerate deals stuck in negotiation, revisit pricing on stalled proposals, or temporarily reallocate a rep toward prospecting if the gap is large.
- Set escalation thresholds. Decide in advance what coverage drop triggers a leadership conversation, rather than discovering the problem in the final week of the quarter.
Weekly review cadence catches problems while there's still time to fix them. A coverage decline over one or two weeks with no matching increase in close activity almost always signals a pipeline generation problem, not a closing problem, and those two issues need completely different fixes.
Common Pipeline Coverage Mistakes to Avoid
Most coverage problems aren't math errors. They're process shortcuts that quietly corrupt the number until it stops meaning anything.
- Trusting raw coverage alone. A big raw number feels good right up until you weight it and discover half the pipeline is still in early discovery.
- Applying 3x without checking win rate. A team with a 20% win rate needs 5x, not 3x; using the generic rule leaves that team perpetually short and confused about why.
- Counting deals outside the measurement period. Pipeline with close dates two quarters out shouldn't count toward this quarter's coverage, no matter how big it makes the total look.
- Relying on one aggregate number. Company-wide coverage can mask a segment or region in genuine crisis while the average looks fine on the executive dashboard.
- Ignoring the trend. A single healthy snapshot means less than three consecutive weeks of decline with no new pipeline behind it.
How Sales Phoenix Fixes Coverage Problems
Most coverage shortfalls trace back to the same root causes: unqualified deals inflating the count, no stage-weighting in the reporting, and no one segmenting by rep or motion until it's too late to fix. Sales-phoenix's revenue intelligence work starts by rebuilding the weighted view from clean data, so leadership sees the real number instead of a comforting one.

Client engagements consistently surface the same pattern: pipeline that looks adequate in aggregate but is dangerously thin in one segment, one rep's book, or one product line. Fixing that isn't about adding more leads. It's about diagnosing where the leak actually is, then rebuilding the qualification rules and activity targets around it.
A short Revenue Leak Assessment typically starts with a data hygiene pass, a weighted coverage recalculation by segment, and a gap analysis that turns the shortfall into a concrete activity plan within one to two weeks.
When Coverage Numbers Should Trigger a Bigger Strategic Move
A single bad week of coverage means run your playbook: more activity, tighter follow up. A coverage ratio that stays below your derived target for two or three consecutive quarters means something structural is broken, and no amount of extra dialing fixes it.
That's the signal to change motion, reprice, or hire, not just push harder. Ask three questions: Has win rate actually declined, or is the pipeline just thinner? Is the gap concentrated in one segment, or spread everywhere? And has deal cycle length crept up without anyone noticing? Persistent shortfalls with a stable win rate usually mean a generation problem. Persistent shortfalls with a declining win rate mean the market or your qualification bar has shifted.
— Hunter
Fixing Coverage Gaps With Sales Phoenix
A dashboard can tell you your coverage is thin. It won't tell you why, and it definitely won't fix it. That's the gap between the diagnostic tools most teams already have and what Sales-phoenix actually delivers: a segmented, stage-weighted read on your pipeline paired with a specific plan to close the shortfall, not just a prettier chart.

The Revenue Leak Assessment walks through your qualification rules, cleans out the stale and duplicate deals inflating your raw number, and rebuilds coverage by segment so you know exactly where the real risk sits. Pair that with an executive dashboard built around weighted coverage and recency multipliers, and you stop finding out about a shortfall in the last two weeks of the quarter. If your coverage number has felt unreliable for a while, start with a Revenue Leak Assessment and get a segmented view of where the gap actually lives.
Sources
The Pipeline Coverage Ratio breakdown from Inveo covers segment benchmarks and hygiene rules in more depth. Alex Berman's guide explains the win-rate-based target formula. Monday.com's overview is a solid reference for the base calculation, and ORM's piece on weekly cadence is worth reading for the monitoring rhythm.
- Sales Pipeline Coverage: Formula, Ideal Ratios & Examples
- Pipeline Coverage Ratio: Benchmarks by Deal Cycle and the Data Behind the Number
- Practitioner guidance on pipeline segmentation and limits of aggregate coverage